

Installation & Usage
A quick and easy way to visualize the VOLO™ Scores in your application
Embedding the Health Score Widget
Drop the VOLO™ Health Score widget into any web application with a single <script> tag. The widget renders an interactive, animated report from a scoring response passed directly from your server — your API key never touches the browser.
Architecture & Security
The widget is designed with a server-side-first pattern. Your backend authenticates with the VOLO™ Health Scoring API, fetches the timeseries response, and passes the JSON payload to the frontend. The widget then renders entirely client-side with no additional network calls.
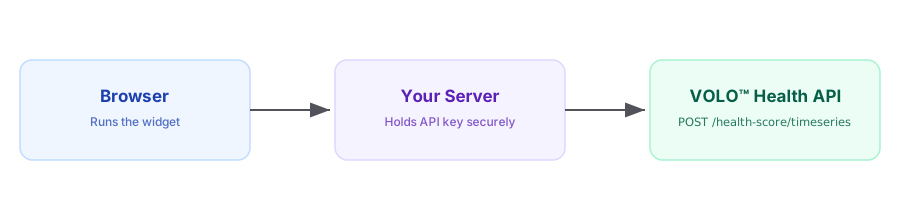
Never expose your API key in the browserAll calls to
https://api.voloridgehealth.commust be made server-side. The widget only ever receives the already-computed JSON response.
Installation
Add the CDN script tag to your page.
<!-- Add to your <head> or before </body> -->
<script src="https://components.volohealth.com/vhr/v1/index.js"></script>
Chart.js is loaded automatically via the CDN build if not already present on the page.
Integration Steps
1. Add backend routes that call the VOLO™ Health Scoring API
Your server needs two routes that the browser can call: one that returns the scoring response, and one (optional) that returns predictor statistics. Both routes should call the VOLO™ Health Scoring API server-side, using your secret API key, and forward the JSON response to the browser.
const express = require('express');
const router = express.Router();

router.get('/api/scoring', async (req, res) => {
  const response = await fetch('https://api.voloridgehealth.com/health-score/timeseries', {
    method: 'POST',
    headers: {
      'Content-Type': 'application/json',
      // Store your key securely (env var, secrets manager, etc.)
      'x-api-key': process.env.VHR_API_KEY
    },
    body: JSON.stringify({
      scoring_event_metadata: {
        event_id: crypto.randomUUID(),
        event_asof_dtutc: new Date().toISOString(),
        mode: 'validate_and_score'
      },
      uid_ext: req.user.id,
      dates_to_score: ['2023-01-01', '2024-01-01', '2025-01-01', '2026-01-01'],
      date_of_birth: req.user.dateOfBirth,
      health_events: req.user.labEvents  // array of { health_event_id, health_event_date, predictors }
    })
  });

  if (!response.ok) return res.status(response.status).send(await response.text());
  res.json(await response.json());
});

router.get('/api/predictor-stats', async (req, res) => {
  const response = await fetch('https://api.voloridgehealth.com/predictor-statistics/', {
    method: 'POST',
    headers: {
      'Content-Type': 'application/json',
      'x-api-key': process.env.VHR_API_KEY
    },
    body: JSON.stringify({
      header: {
        event_id: crypto.randomUUID(),
        event_asof_dtutc: new Date().toISOString()
      },
      sex: req.user.sex,   // 'male' | 'female'
      age: req.user.age
    })
  });

  if (!response.ok) return res.status(response.status).send(await response.text());
  res.json(await response.json());
});

module.exports = router;
import os, uuid, requests
from flask import Blueprint, request, jsonify, current_app
bp = Blueprint('vhr', __name__)
@bp.route('/api/scoring')
def scoring():
payload = {
"scoring_event_metadata": {
"event_id": str(uuid.uuid4()),
"event_asof_dtutc": "2026-01-15T10:00:00Z",
"mode": "validate_and_score"
},
"uid_ext": current_user.id,
"dates_to_score": ["2023-01-01", "2024-01-01", "2025-01-01", "2026-01-01"],
"date_of_birth": current_user.date_of_birth,
"health_events": current_user.lab_events
}
r = requests.post(
"https://api.voloridgehealth.com/health-score/timeseries",
json=payload,
headers={"x-api-key": os.environ["VHR_API_KEY"]}
)
return jsonify(r.json()), r.status_code
@bp.route('/api/predictor-stats')
def predictor_stats():
payload = {
"header": {
"event_id": str(uuid.uuid4()),
"event_asof_dtutc": "2026-01-15T10:00:00Z"
},
"sex": current_user.sex, # "male" | "female"
"age": current_user.age
}
r = requests.post(
"https://api.voloridgehealth.com/predictor-statistics/",
json=payload,
headers={"x-api-key": os.environ["VHR_API_KEY"]}
)
return jsonify(r.json()), r.status_codeRoute::get('/api/scoring', function () {
$payload = [
'scoring_event_metadata' => [
'event_id' => (string) Str::uuid(),
'event_asof_dtutc' => now()->toIso8601String(),
'mode' => 'validate_and_score',
],
'uid_ext' => auth()->id(),
'dates_to_score' => ['2023-01-01', '2024-01-01', '2025-01-01', '2026-01-01'],
'date_of_birth' => auth()->user()->date_of_birth,
'health_events' => auth()->user()->labEvents,
];
$response = Http::withHeaders([
'x-api-key' => config('vhr.api_key'), // from env, never hardcoded
'Content-Type' => 'application/json',
])->post('https://api.voloridgehealth.com/health-score/timeseries', $payload);
return response($response->body(), $response->status())
->header('Content-Type', 'application/json');
});
Route::get('/api/predictor-stats', function () {
$payload = [
'header' => [
'event_id' => (string) Str::uuid(),
'event_asof_dtutc' => now()->toIso8601String(),
],
'sex' => auth()->user()->sex, // 'male' | 'female'
'age' => auth()->user()->age,
];
$response = Http::withHeaders([
'x-api-key' => config('vhr.api_key'),
'Content-Type' => 'application/json',
])->post('https://api.voloridgehealth.com/predictor-statistics/', $payload);
return response($response->body(), $response->status())
->header('Content-Type', 'application/json');
});2. Add a container element and load the widget script
Add an empty container <div> and load the widget script from the CDN.
<div id="vhr">Loading…</div>
<script src="https://components.volohealth.com/vhr/v1/index.js"></script>
3. Fetch your backend routes and render the widget
From the browser, call your own /api/scoring and /api/predictor-stats routes (not the VOLO™ API directly), then pass the results to VhrWidget.render().
<!doctype html>
<html lang="en">
  <head>
    <meta charset="UTF-8" />
    <meta name="viewport" content="width=device-width, initial-scale=1.0" />
    <title>VHR Widget — usage example</title>
    <style>
      body { font-family: system-ui, sans-serif; max-width: 1100px; margin: 24px auto; padding: 0 20px; }
      #vhr { min-height: 400px; }
      .err { color: #900; background: #fee; padding: 12px; border-radius: 6px; white-space: pre-wrap; }
    </style>
  </head>
  <body>
    <h1>VHR Widget</h1>
    <div id="vhr">Loading…</div>
    <script src="https://components.volohealth.com/vhr/v1/index.js"></script>
    <script>
      Promise.all([
        fetch('/api/scoring').then(handle),         // required
        fetch('/api/predictor-stats').then(handle), // optional — range bars degrade without it
      ])
        .then(function ([scoring, predictorStats]) {
          document.getElementById('vhr').textContent = '';
          VhrWidget.render('#vhr', { scoring: scoring, predictorStats: predictorStats, reportName: 'Jane Doe', theme: 'light' });
        })
      function handle(r) {
        if (!r.ok) return r.text().then(function (t) { throw new Error(r.status + ' ' + t); });
        return r.json();
      }
    </script>
  </body>
</html>
predictorStatsis optionalIf
/api/predictor-statsfails or is omitted, the widget still renders usingscoringalone — range bars and population-context indicators simply won't be shown.
API Reference
VhrWidget.render(selector, options)
VhrWidget.render(selector, options)| Parameter | Type | Description |
|---|---|---|
selector | string | CSS selector for the container element (e.g. '#vhr'). |
options object:
| Property | Type | Required | Description |
|---|---|---|---|
scoring | object | Yes | The full JSON response from POST /health-score/timeseries, proxied through your own backend. |
predictorStats | object | null | No | The full JSON response from POST /predictor-statistics/, proxied through your own backend. When provided, the widget displays population means, optimal ranges, and Quest lab reference ranges (range bars) alongside each biomarker. |
reportName | string | No | Name displayed in the widget header (e.g. the patient/user's name). |
theme | 'light' | 'dark' | No | Widget color theme. |
Expected Data Structure
The widget expects the complete, unmodified response from POST /health-score/timeseries as the scoring option. The key fields it uses are:
| Field path | Used for |
|---|---|
scoring_results[].scoring_event_date | Labels on charts and history table |
scoring_results[].disease_scores[].disease_code | Identifying which domain each score belongs to |
scoring_results[].disease_scores[].health_score | Score value and max for gauge, radar, history |
scoring_results[].disease_scores[].disease_age | Biological age display and delta indicator |
scoring_results[].disease_scores[].risk_ratios | 10-year risk comparison vs. peer average |
scoring_results[].disease_scores[].score_percentile | "Top X% of peers" caption |
scoring_results[].disease_scores[].predictor_attributions[] | Key biomarker impact list in domain tab |
scoring_results[].scoring_predictors[] | Biomarker values, units and imputation codes |
Timeseries vs. Batch endpointThe widget is optimized for the
/timeseriesendpoint, which scores one user across multiple health events. The additionalscoring_event_age/scoring_event_datefields enable the trend charts. The response from batch endpoint cannot be used directly as there is no trend data. You will need to transform the result to match the timeseries response structure, with a single event date, for it show the data for a point in time VOLO™ Score.
The final output
Below is what the report will look like once embedded in your application. The output component is responsive in its display and will adjust to different form factors such as mobile and tablet screens.
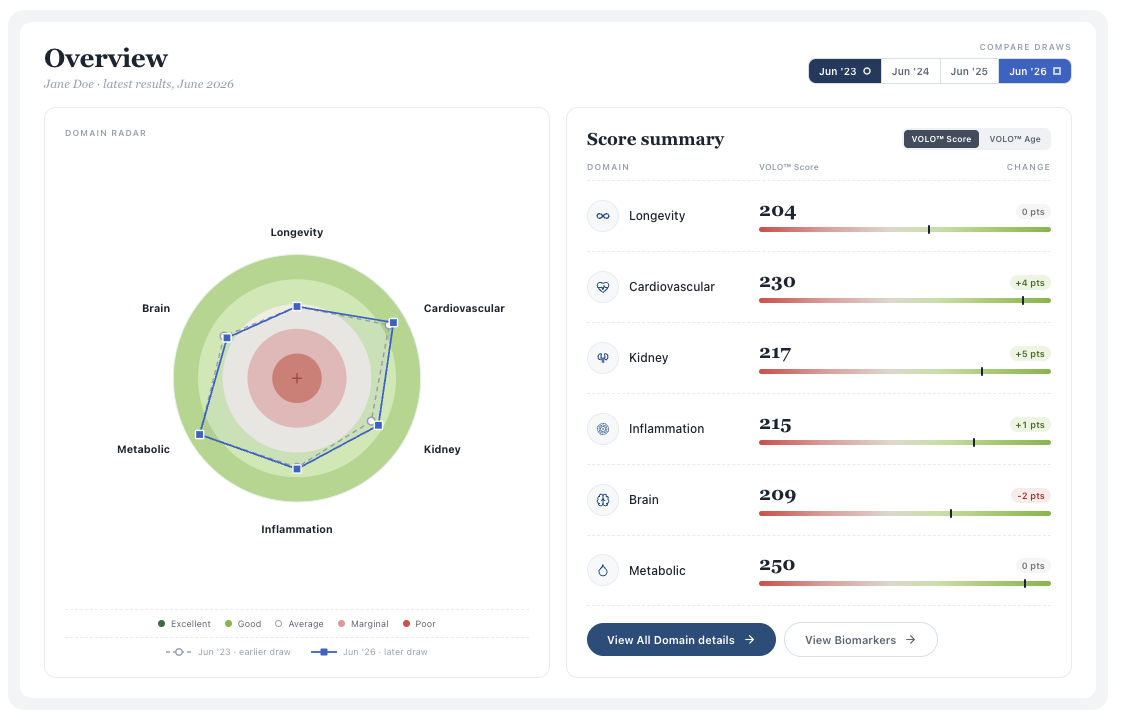
Figure 1: The overview of your scores for different health domains
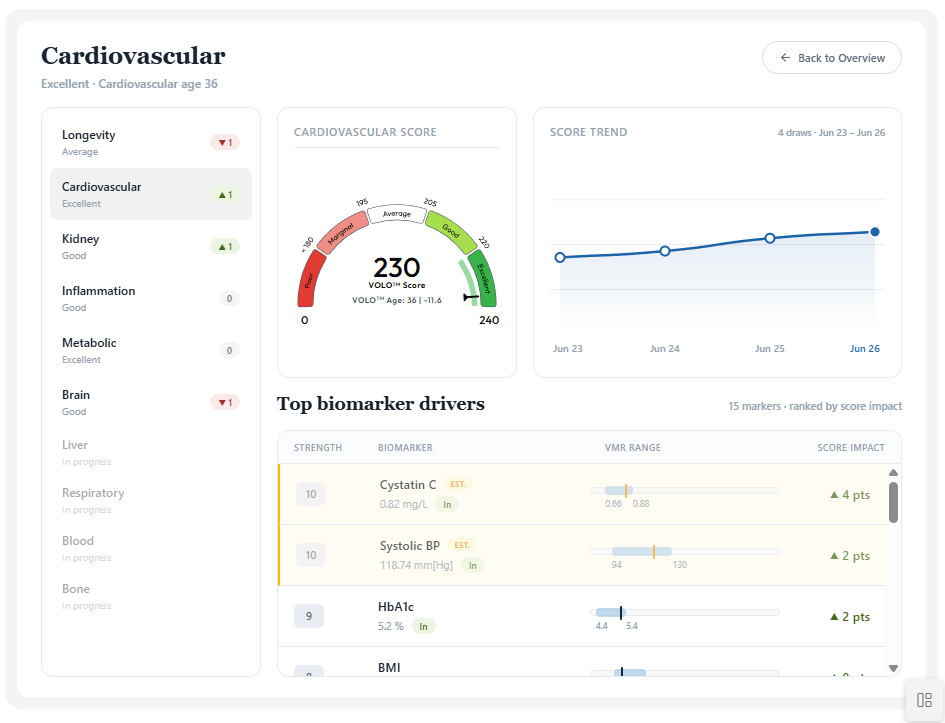
Figure 2: Drilldown into a score for a particular health domain
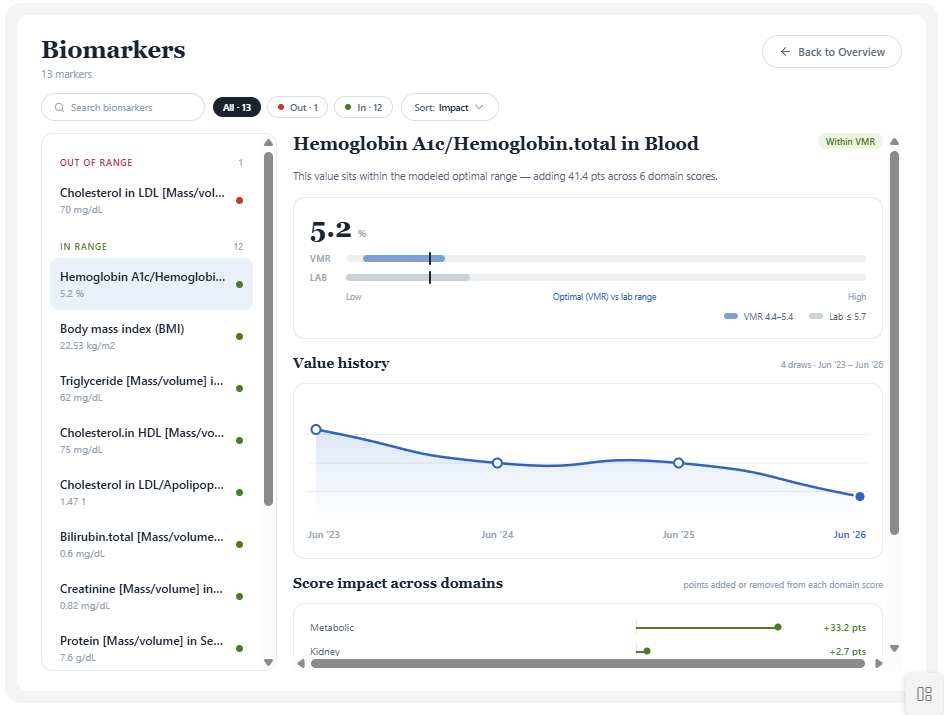
Figure 3: Drilldown further into the Biomarkers that effect the score for the health domain
Updated about 1 month ago